Debugger
Debugger It is a process analysis to isolate and find the root causes affecting the operation of lines of code. It is used to examine the desired code lines. It is written and saved before the desired code lines.
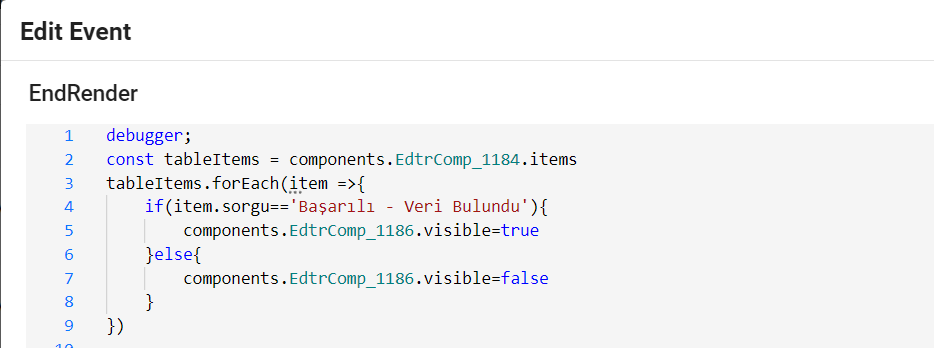
The next step after saving is selecting inspect by right-clicking with the mouse and after switching to preview mode, the debugger runs.
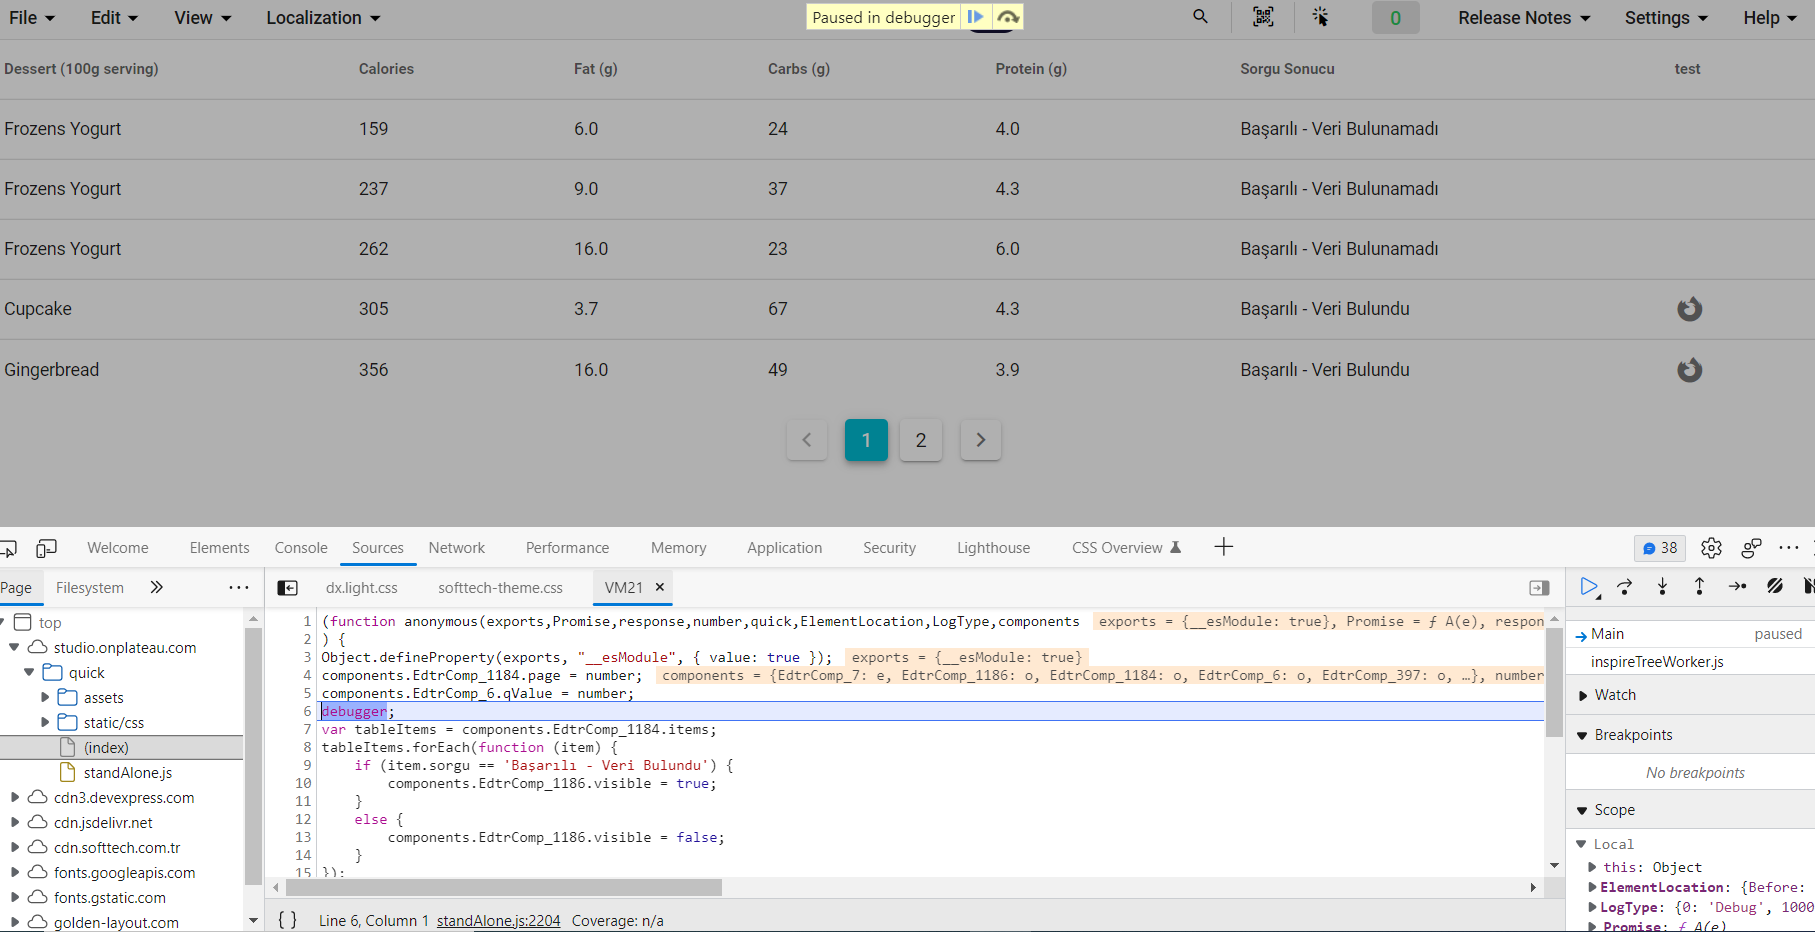
Press the F10 key on the keyboard to examine the code lines one by one. Each time the F10 key is pressed, the next line of code is examined.
In order to examine the code lines one by one, you can click the 'Step over next function call' button with the mouse when the debugger is opened on the screen.
To examine the desired code line, the desired code line is selected. When we want to examine the selected code line directly, the selected code line is reached with F8 and the code line is examined.
It can be passed by clicking 'step into next function call' (f11) to proceed to the next operation.
Removing breakpoints can be removed by clicking 'active breakpoints' (ctrl+f8).
What are browser developer tools?For detailed information, see the link below. https://developer.chrome.com/docs/devtools/