Metrics-Loglake-Mirket Dashboard
Metrics
An endpoint has been created to obtain the metrics of the Symphony project with NodeJS, monitor them on the meerkat platform, and create a dashboard. To activate metric reporting, it will be sufficient to update to the currently communicated versions.
To create a dashboard on Mirket, you need to update to the following versions as specified on the Metrics page.
| Package | Version |
|---|---|
| symphony | @stechquick/symphony@0.2.13 |
| symphony-cli | @stechquick/symphony-cli@0.5.30 |
- After the necessary updates, Metric Exporter integration must be done through Symphony projects for the metrics endpoint.
As an example, when defined the endpoint we provided in the metric exporter, it was observed that the metrics did not reflect on the Loglake Platform as a result of the integration. The problem was solved with the solution suggested by the Metric Exporter team:
Drally.discovery-client.auto-discover=false
The metric exporter directly transmits data to Loglake.
After the metrics are displayed on Loglake, a dashboard can be started on Mirket.
Loglake
You can access Loglake on the Edge browser.
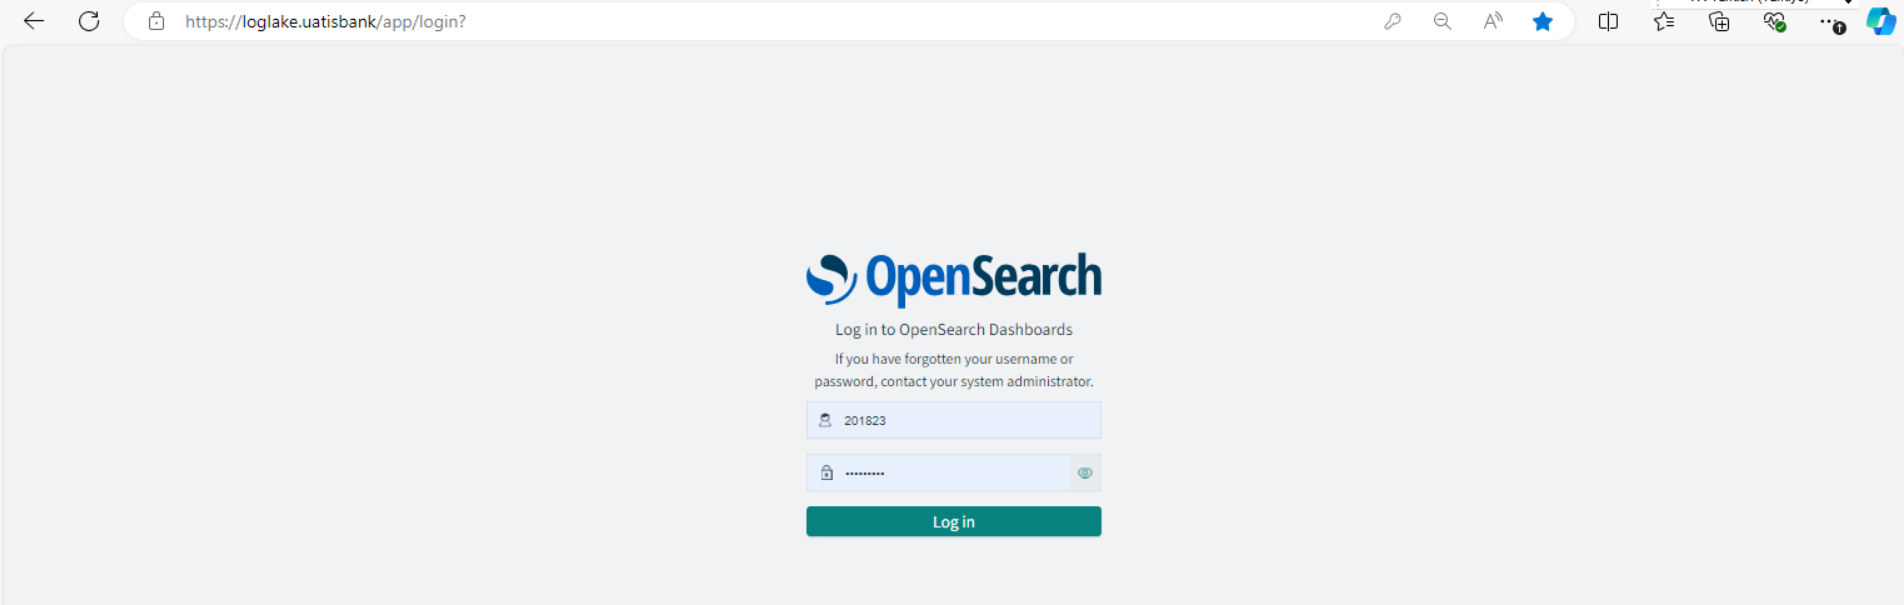
After accessing Loglake, the screen initially appears as shown in the image below.
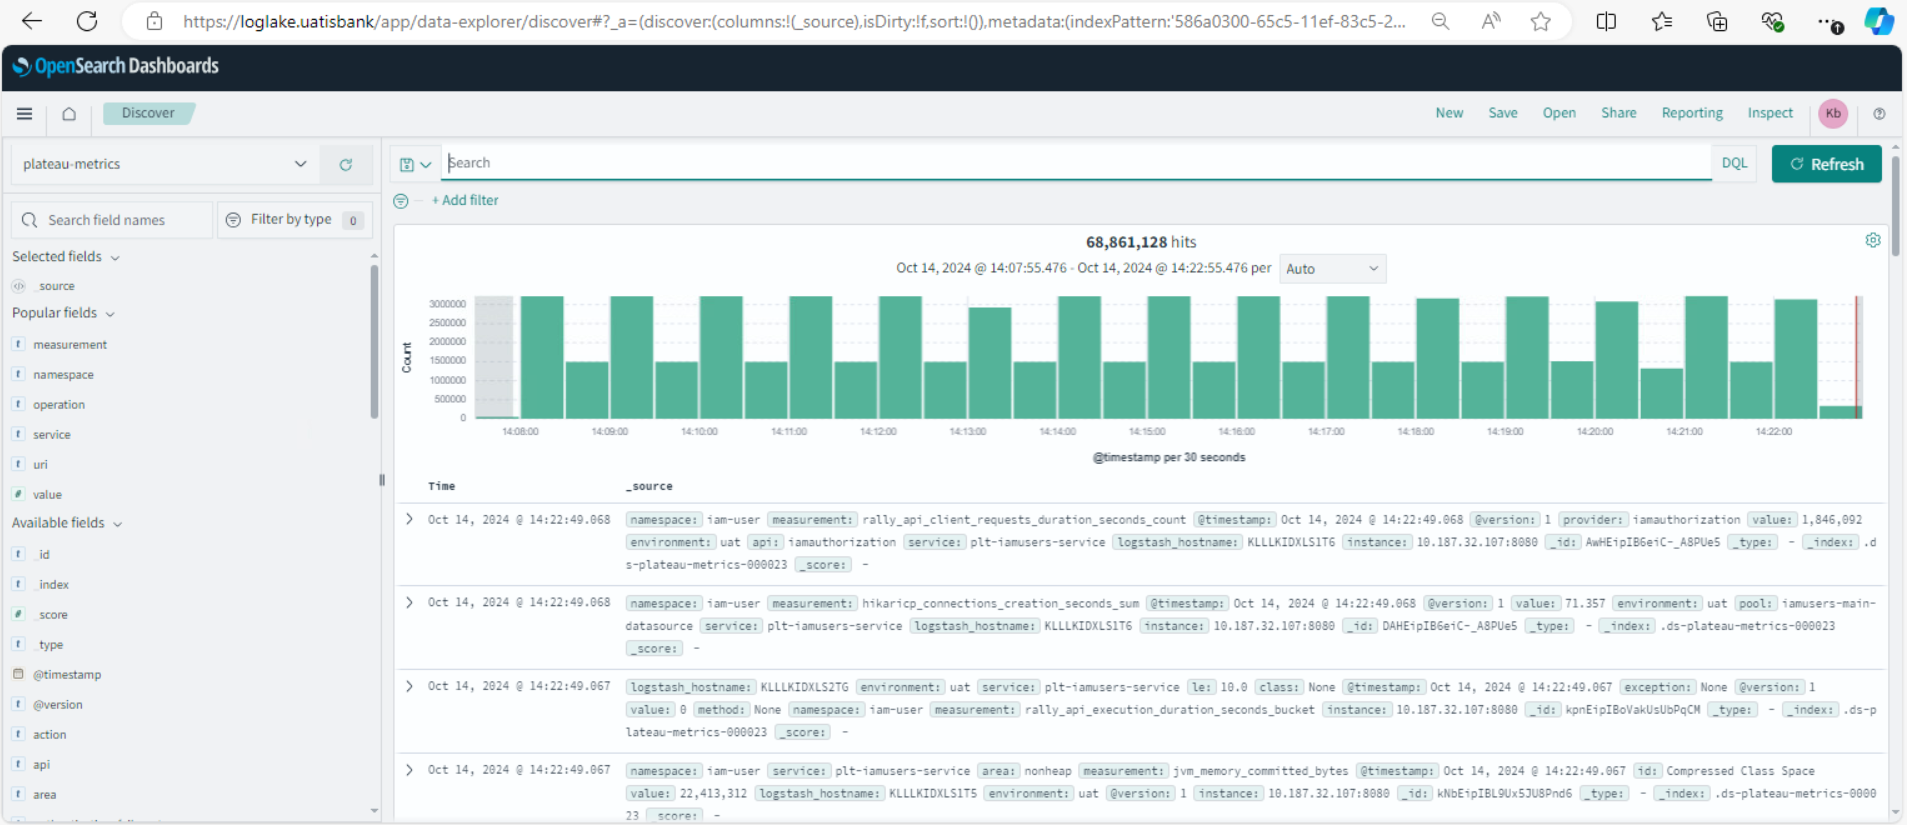
From the marked section on the left side, select plateau-metrics as the platform.
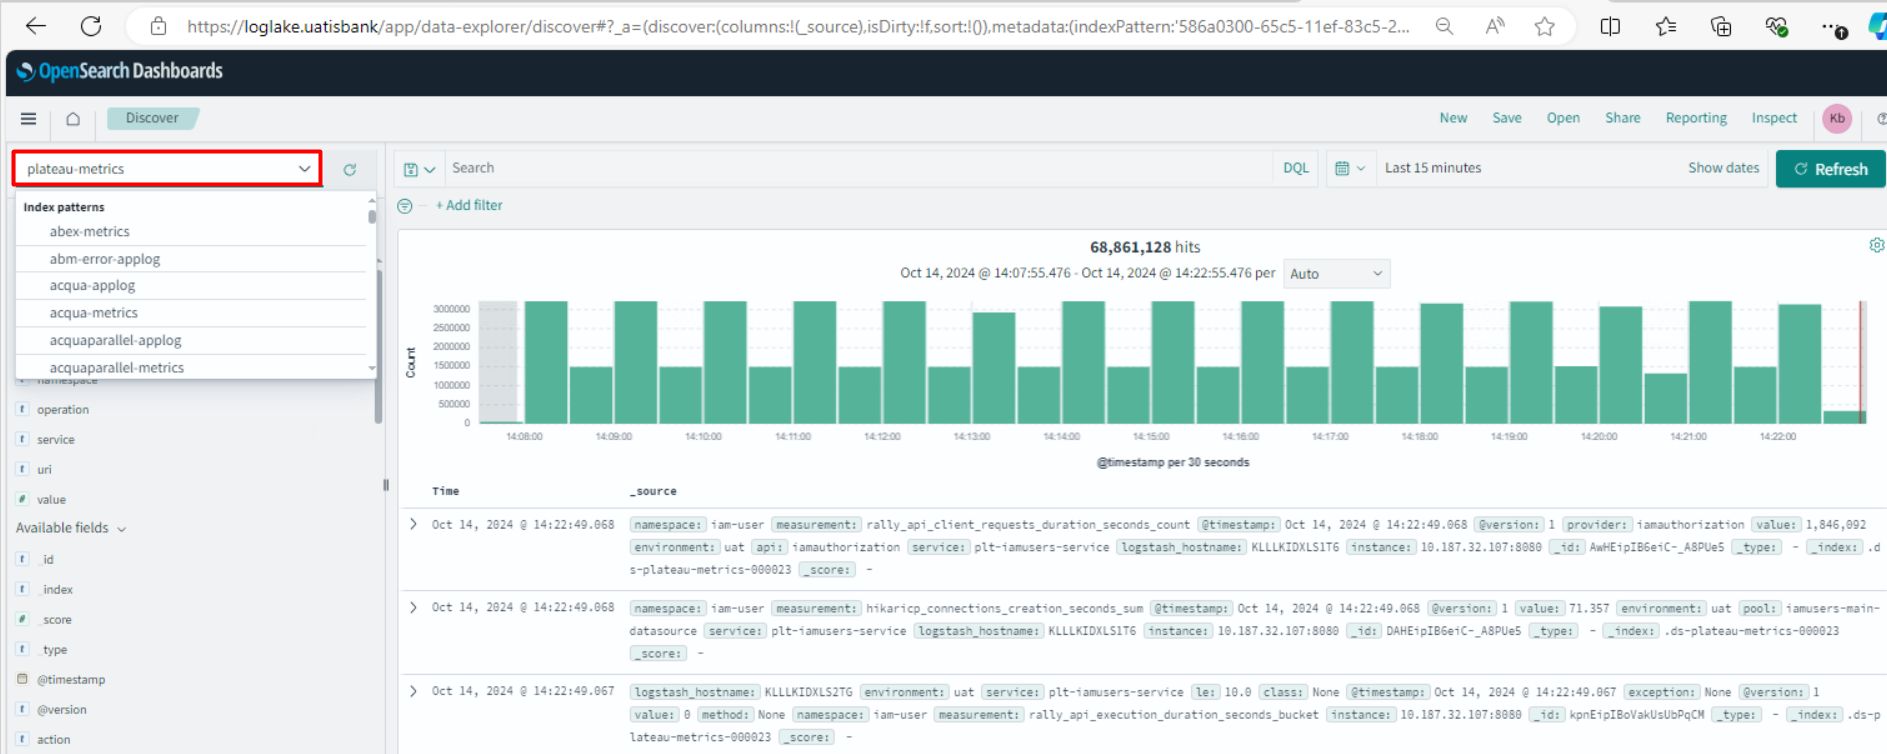
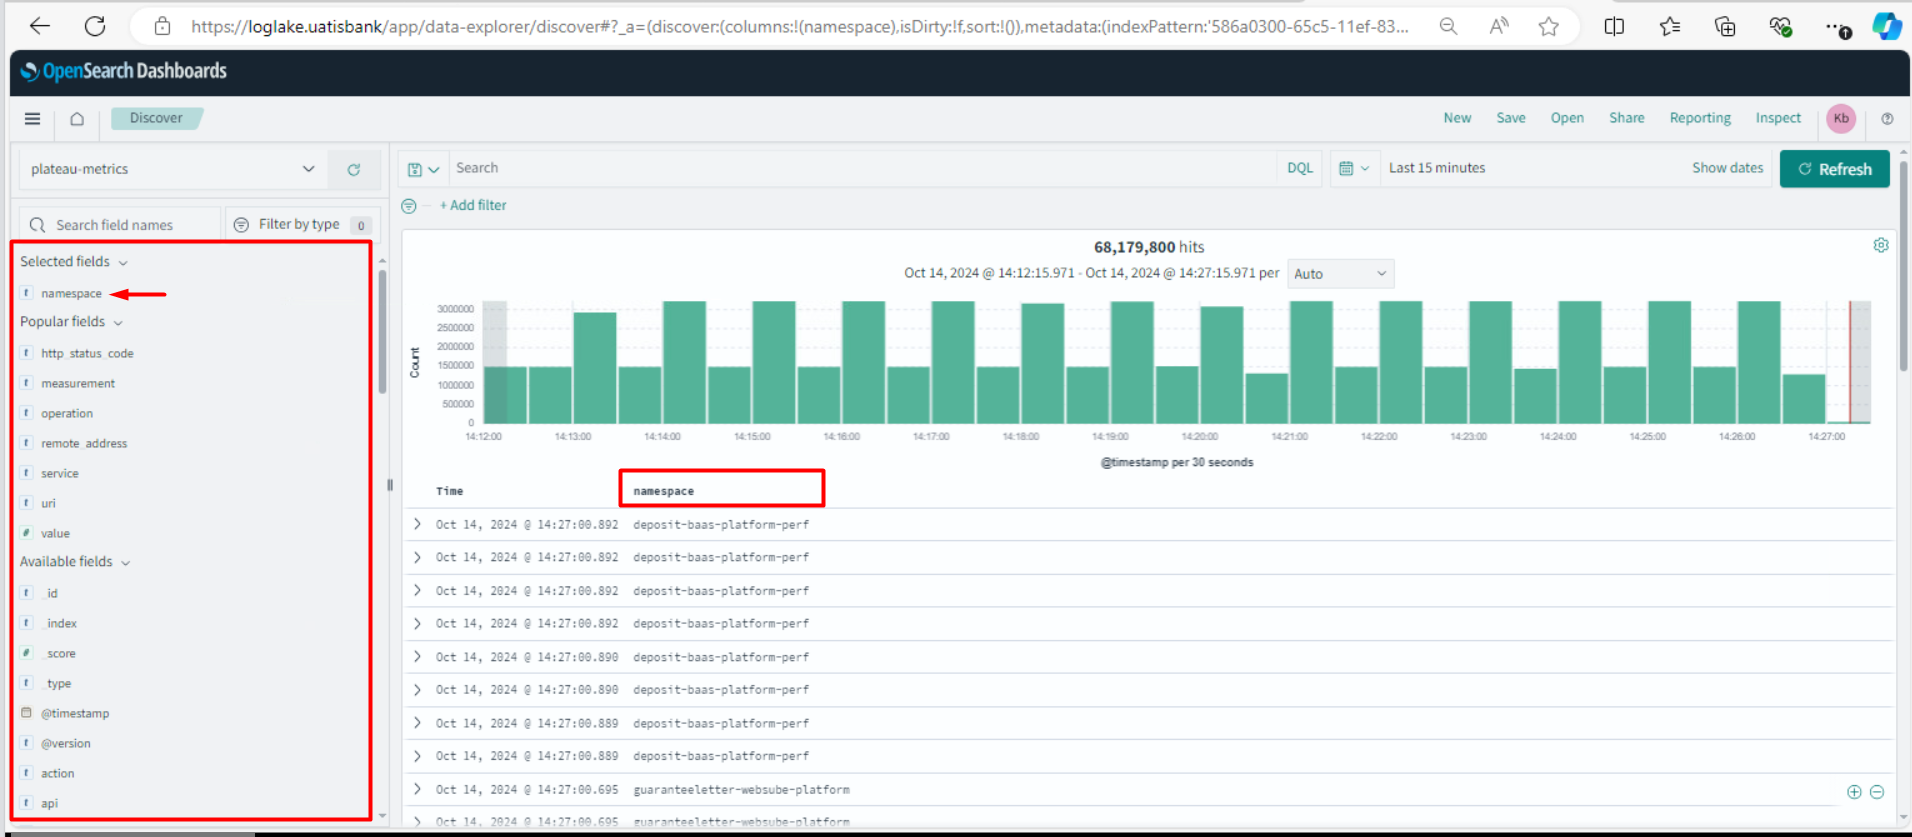
Filtering is done using the Popular Fields section on the left side. When project-based filtering is desired, select the namespace field as shown in the image.
Filtering is done by writing a query in the Search field at the top as shown below. For example project-capera
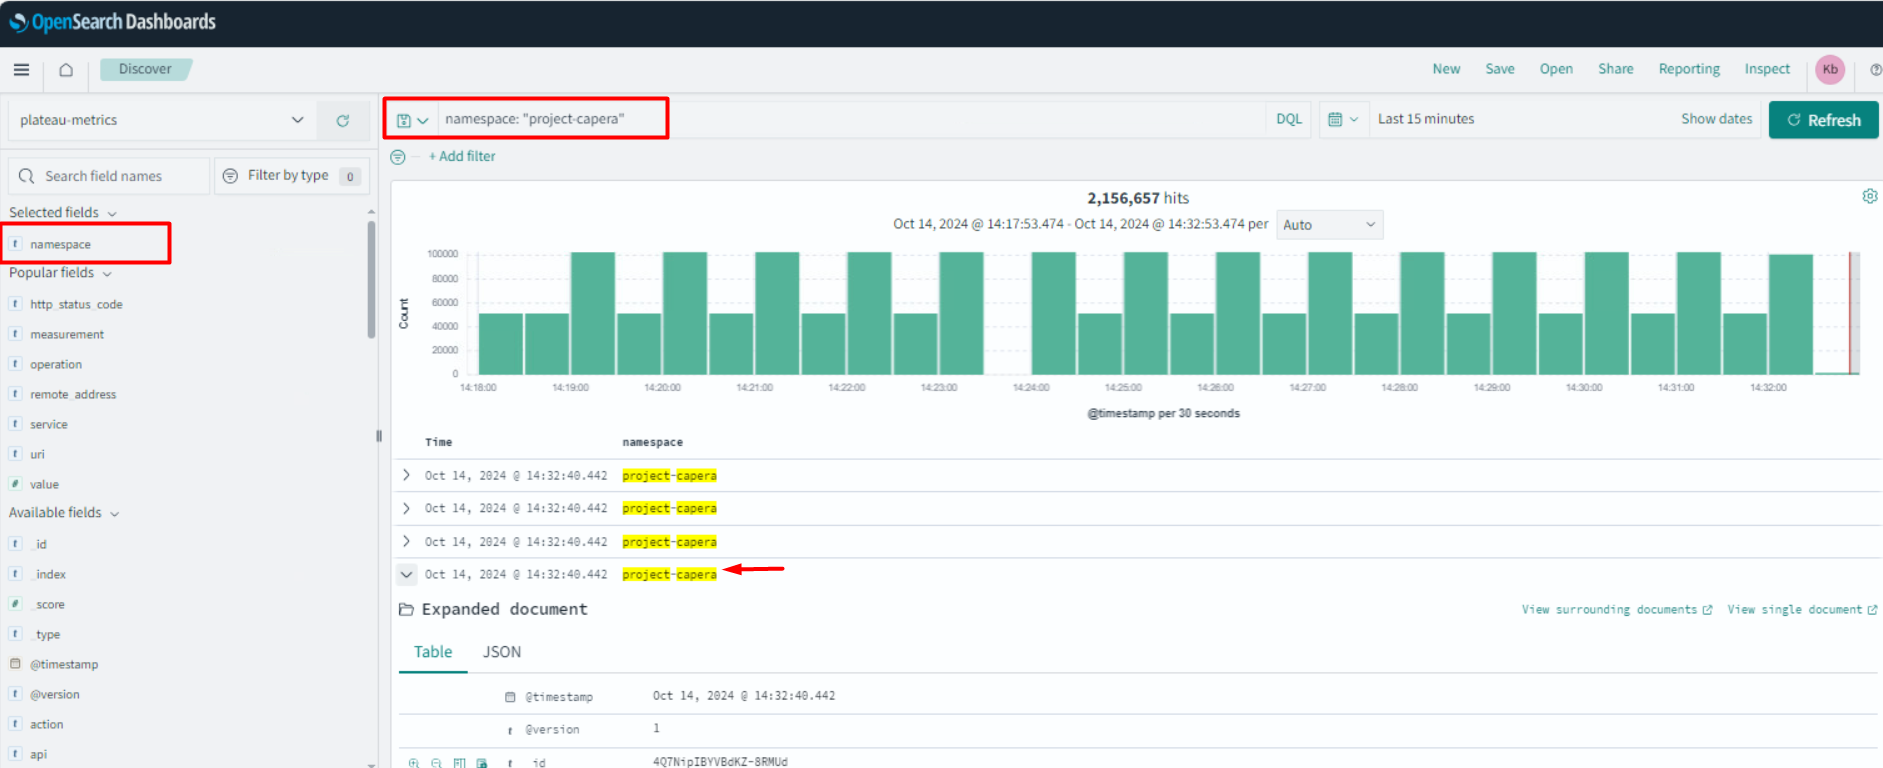
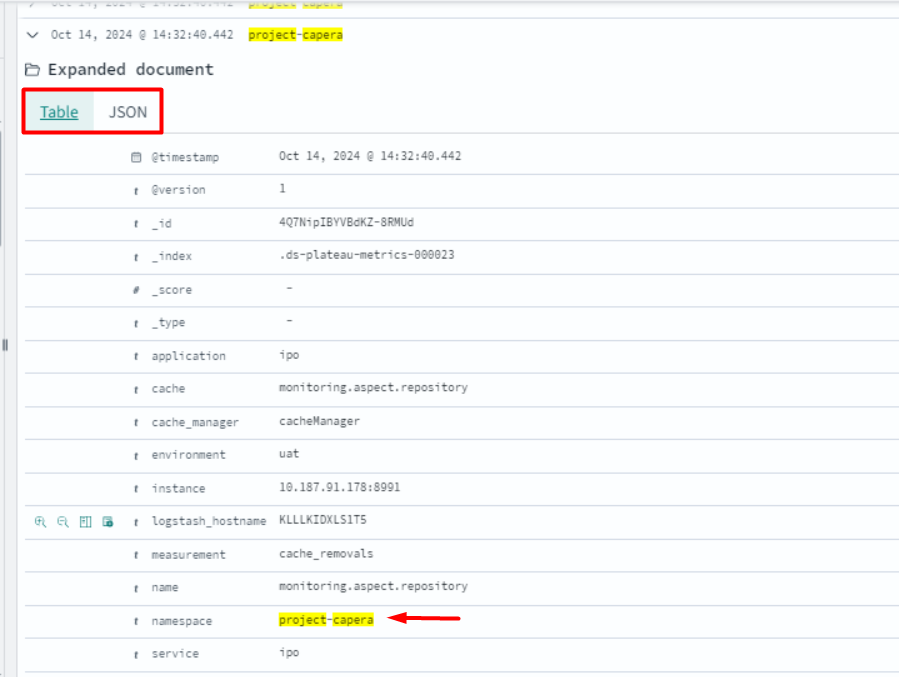
When examining any metric, you can see the metrics in two different ways: for example, Table or JSON.
The metrics related to Symphony service usage within the Capera project are obtained with the following query.
namespace: "project-capera" AND service.keyword: "symphony"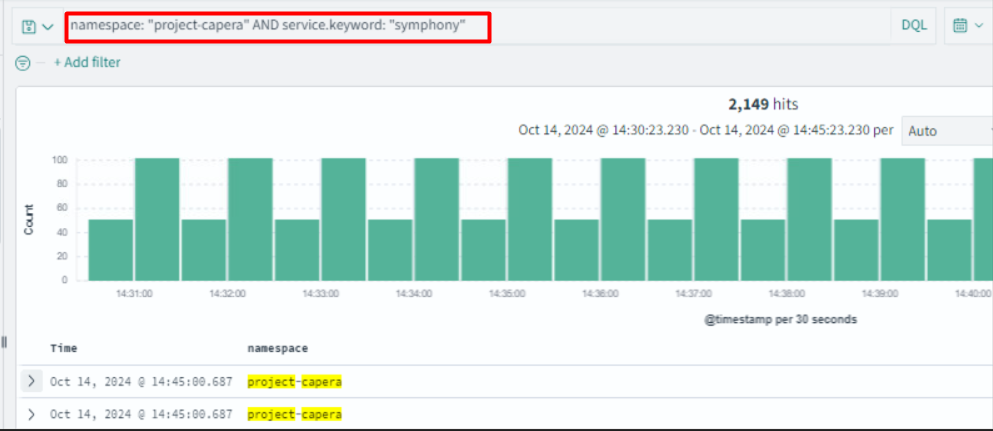
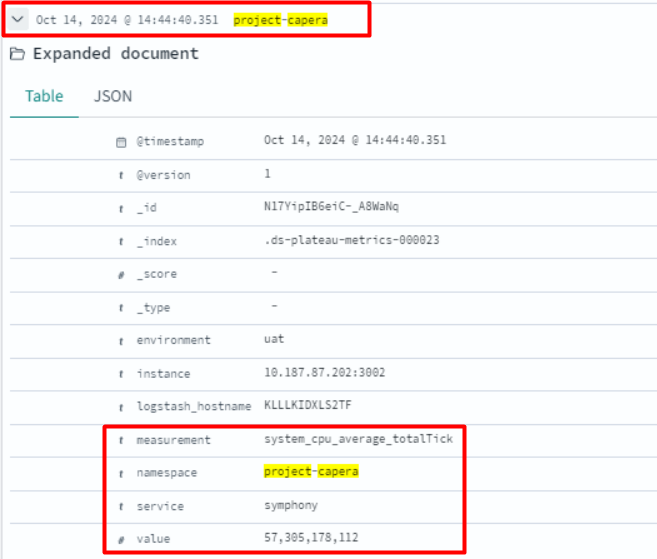
The metrics of the Capera project, where the service.keyword value is symphony, are displayed here.
measurement: The name of the metrics defined within the endpoint.
namespace: Project name
service: symphony
value: The value of the measurement metric.
After the metrics are displayed on Loglake, you can now create a dashboard on the Mirket dashboard.
Mirket Dashboard
Access Mirket through Citrix Workspace.
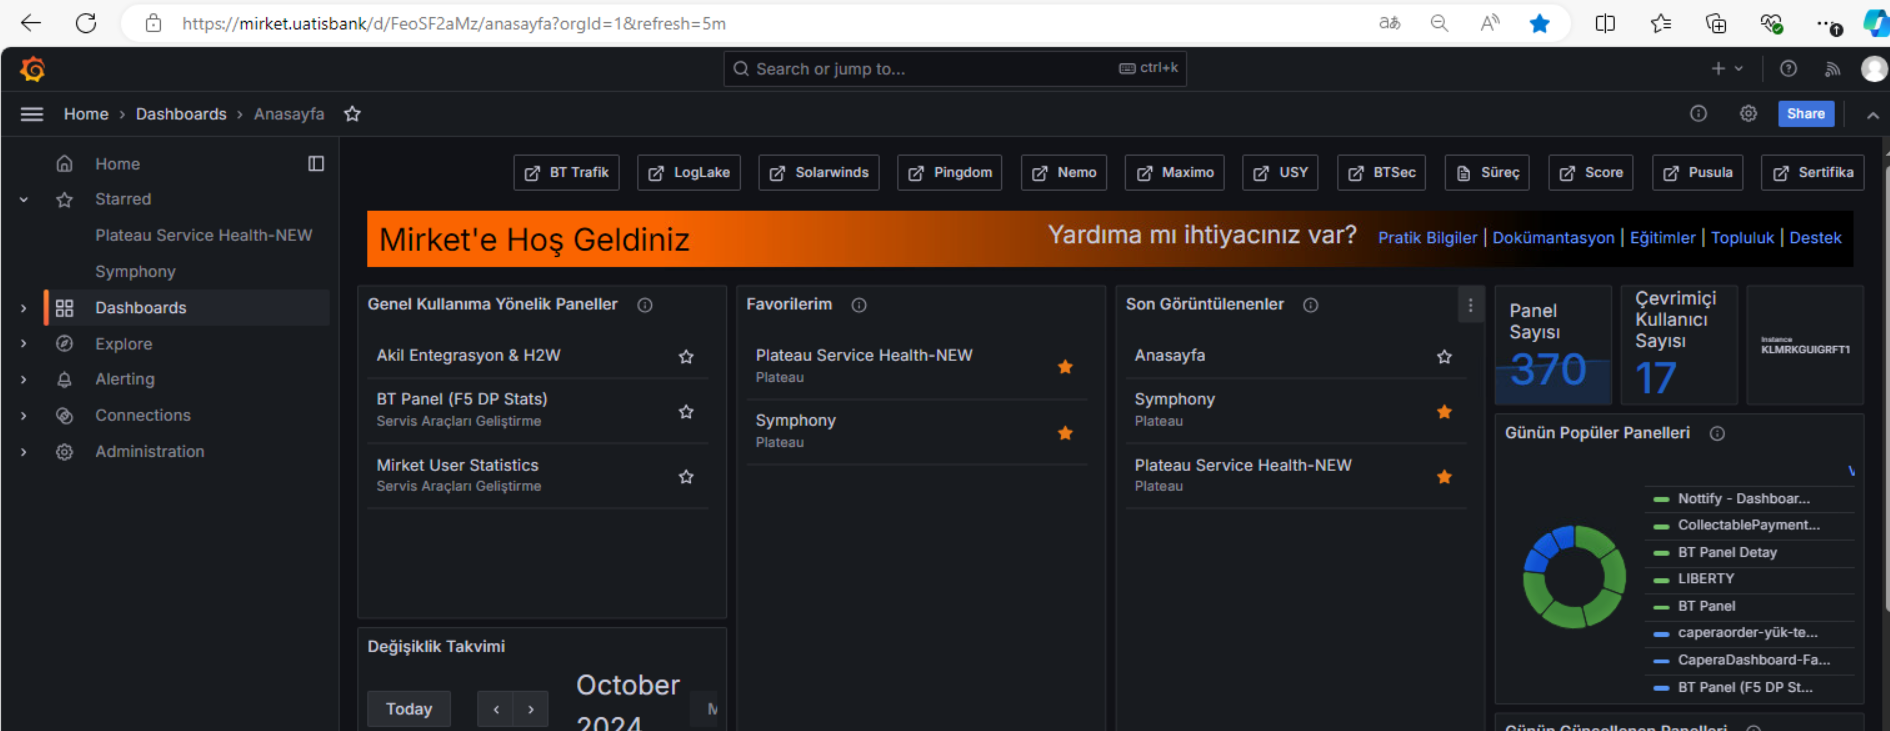
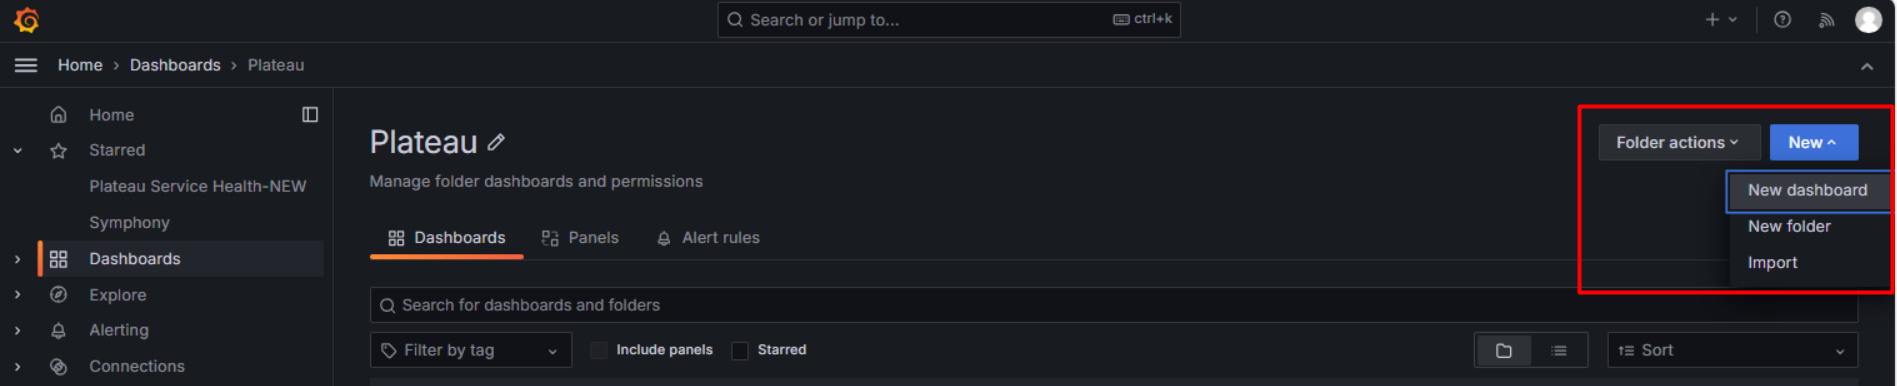
To create a dashboard for the first time, you can click the New button on the right side and then click New Dashboard to create a new dashboard. The created dashboard will be in the current file directory. If you want to create a different folder, you can proceed by selecting New Folder.
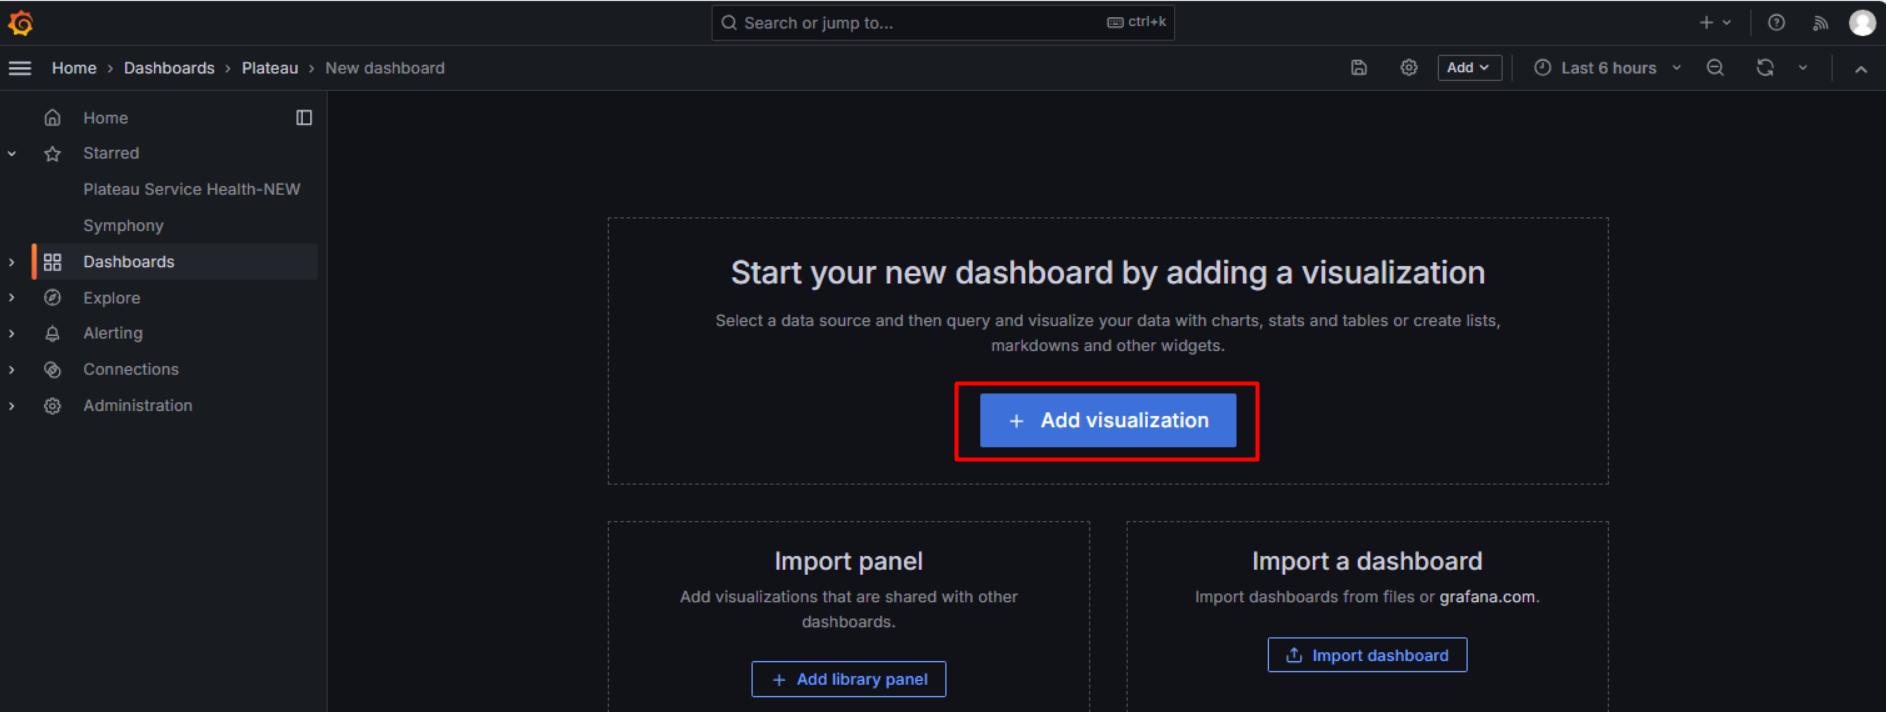
After clicking New Dashboard, the following screen will appear. Continue by clicking Add visualization.
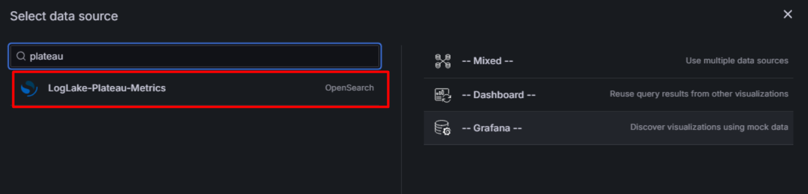
From the opened screen, select Loglake-Plateau-Metrics.
Then, an example dashboard will appear on the screen. Save it directly and save the detailed settings for later.
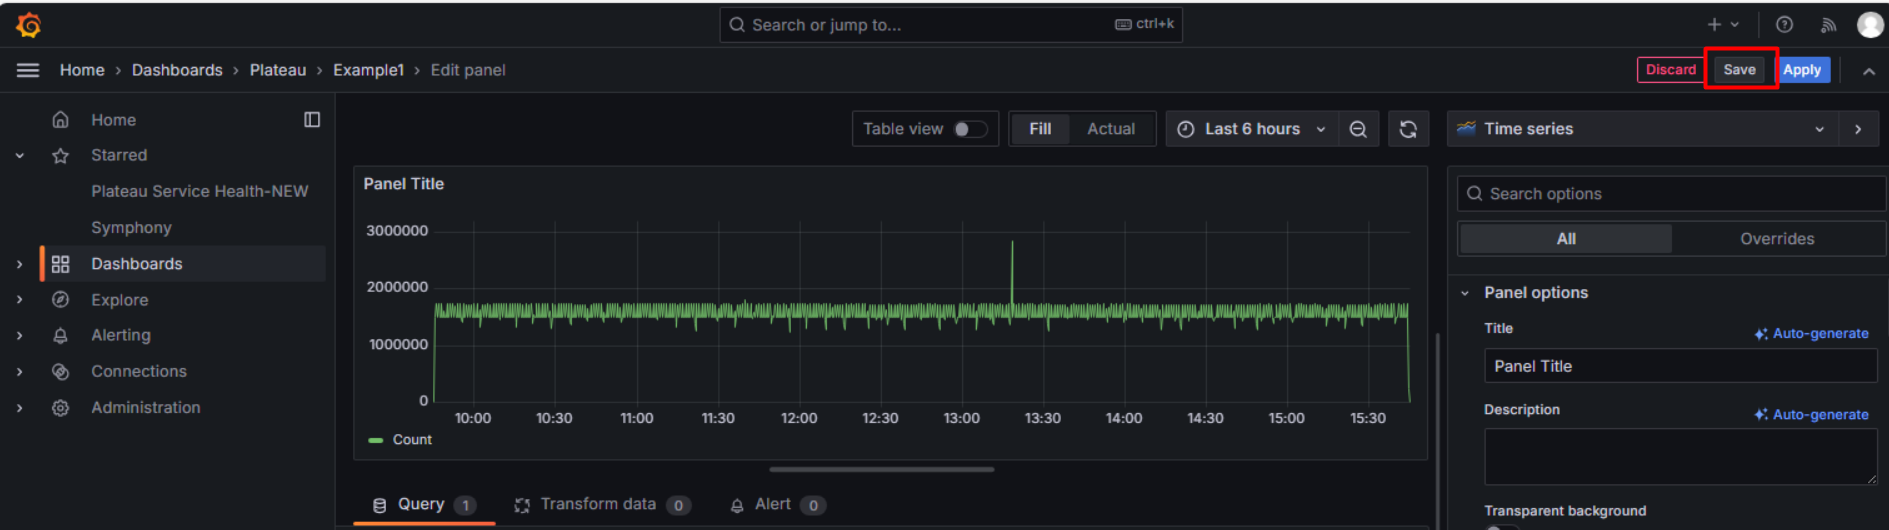
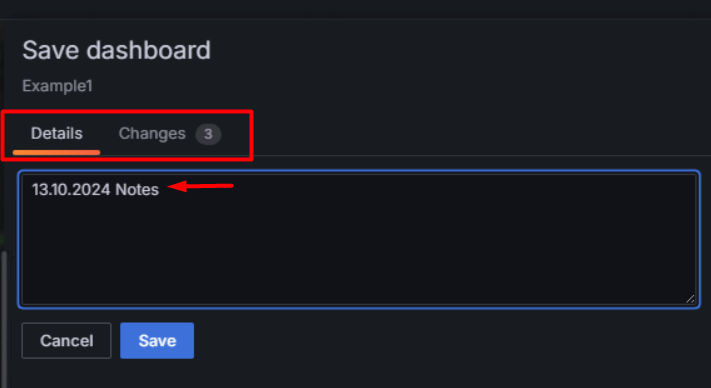
Each time you save the dashboard, a popup will appear where you can specify details about the change or view the previous change.
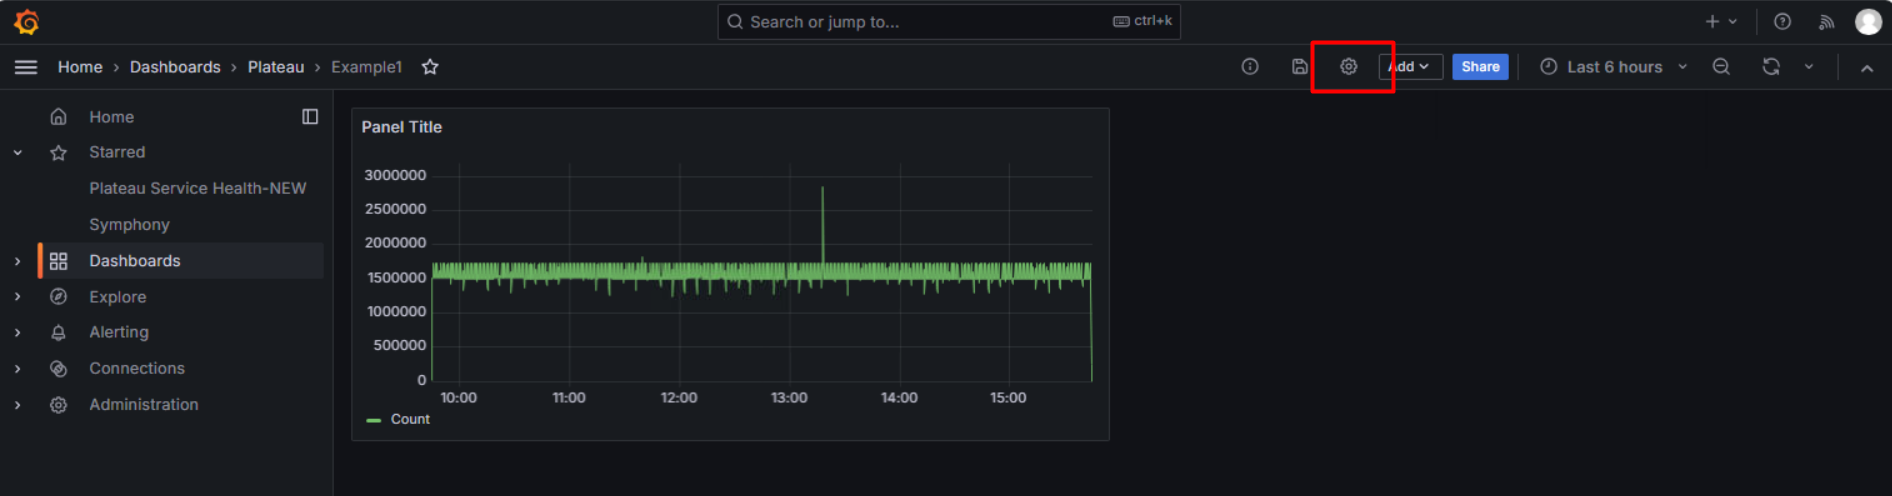
The following actions should be taken for the general settings of the dashboard.
The env variable value for Symphony should be defined as shown in the image.
{"find": "terms", "field": "environment.keyword"}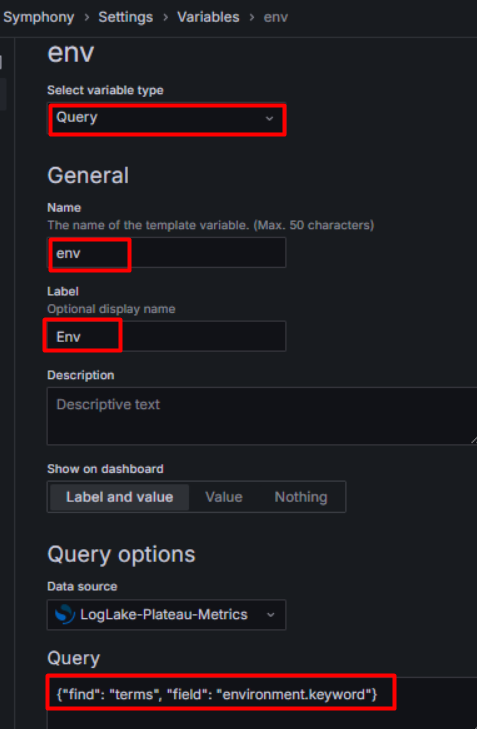
The namespace variable value for Symphony should be defined as shown in the image.
{"find": "terms", "field": "namespace.keyword", "query": "environment.keyword: $env"}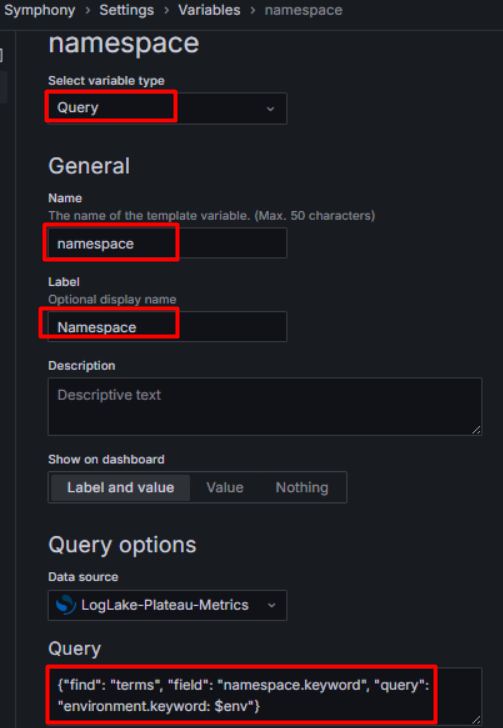
The service variable value for Symphony should be defined as shown in the image.
{"find": "terms", "field": "service.keyword","query": "namespace.keyword: $namespace AND environment.keyword: $env"}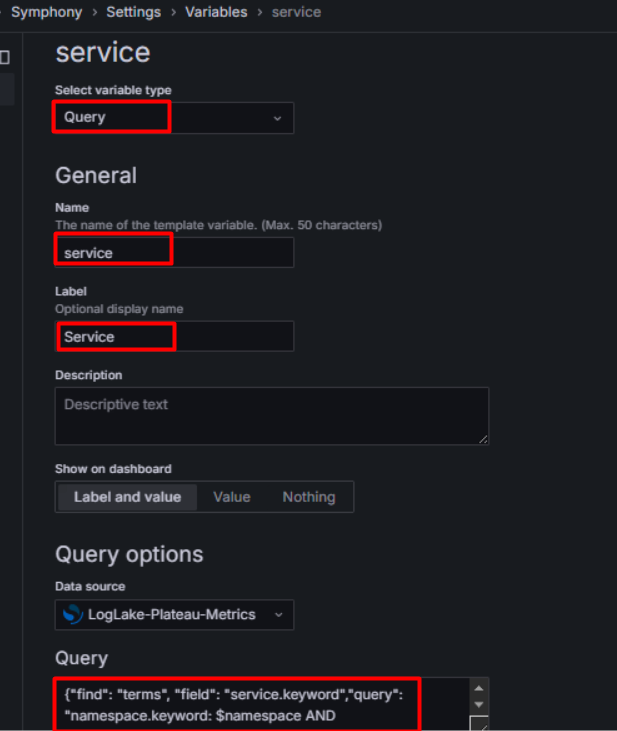
The instance variable value for Symphony should be defined as shown in the image.
{"find": "terms", "field": "instance.keyword", "query": "namespace.keyword: $namespace AND service.keyword: $service AND environment.keyword:$env"}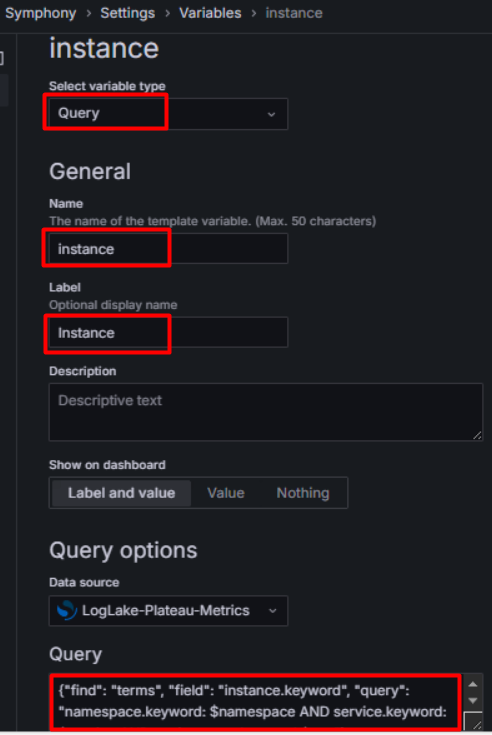
The dashboard is saved using the "Save Dashboard" on the right side.
For example, a dashboard has been added as Symphony under the Plateau Folder.
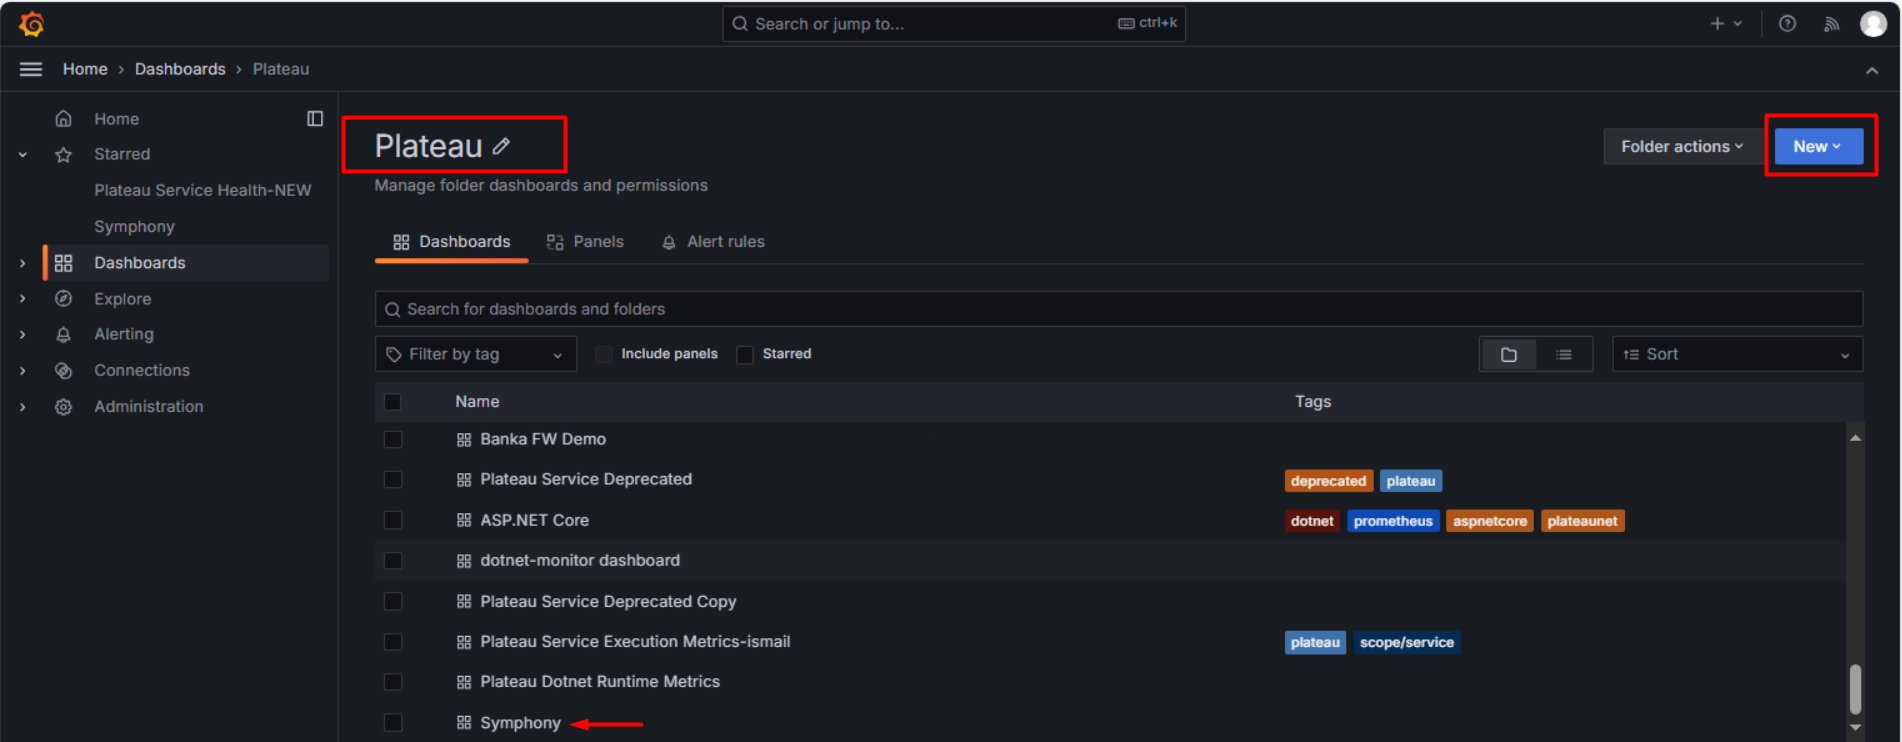
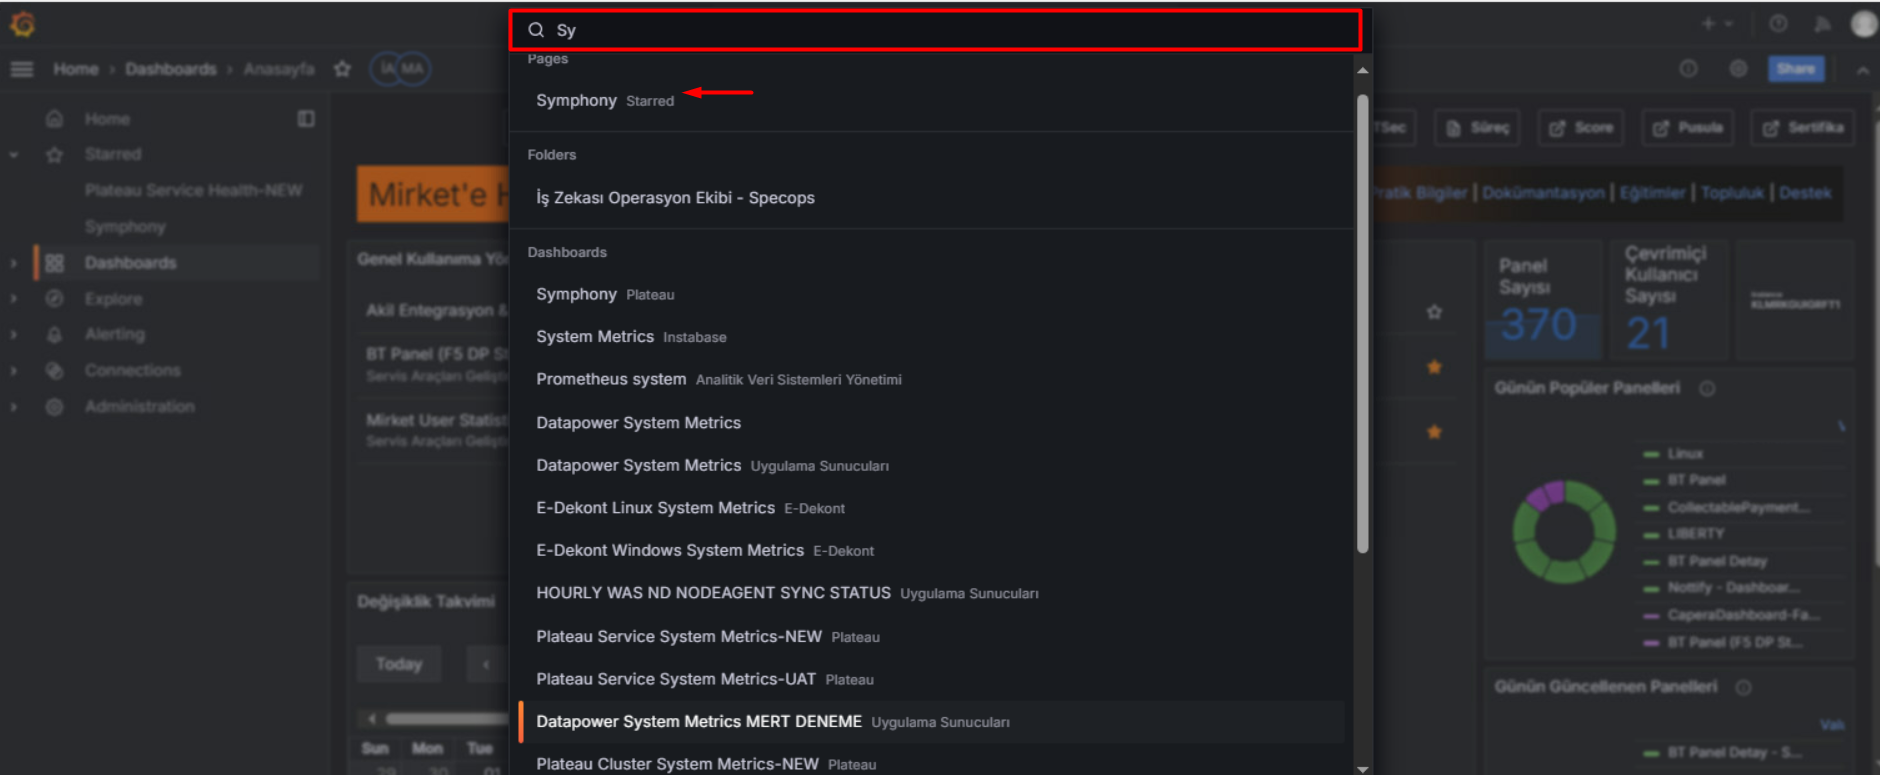
The Symphony Dashboard can be directly accessed by searching in the Search section as shown below.
After accessing the Symphony Dashboard, the filter fields below need to be arranged as shown in the image.
Env: The environment information. Since it is a UAT environment, UAT should be selected.
Namespace: Project name. project-capera should be selected.
Service: Service name. symphony service should be selected.
Instance: Source. The relevant pod should be selected.
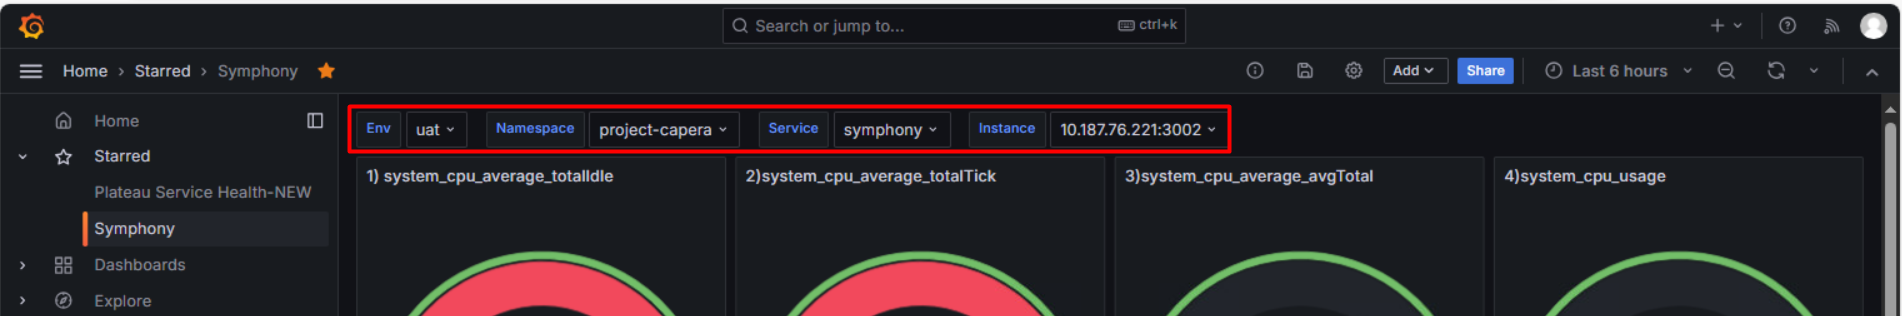
After the necessary settings are made, the dashboard can be created.
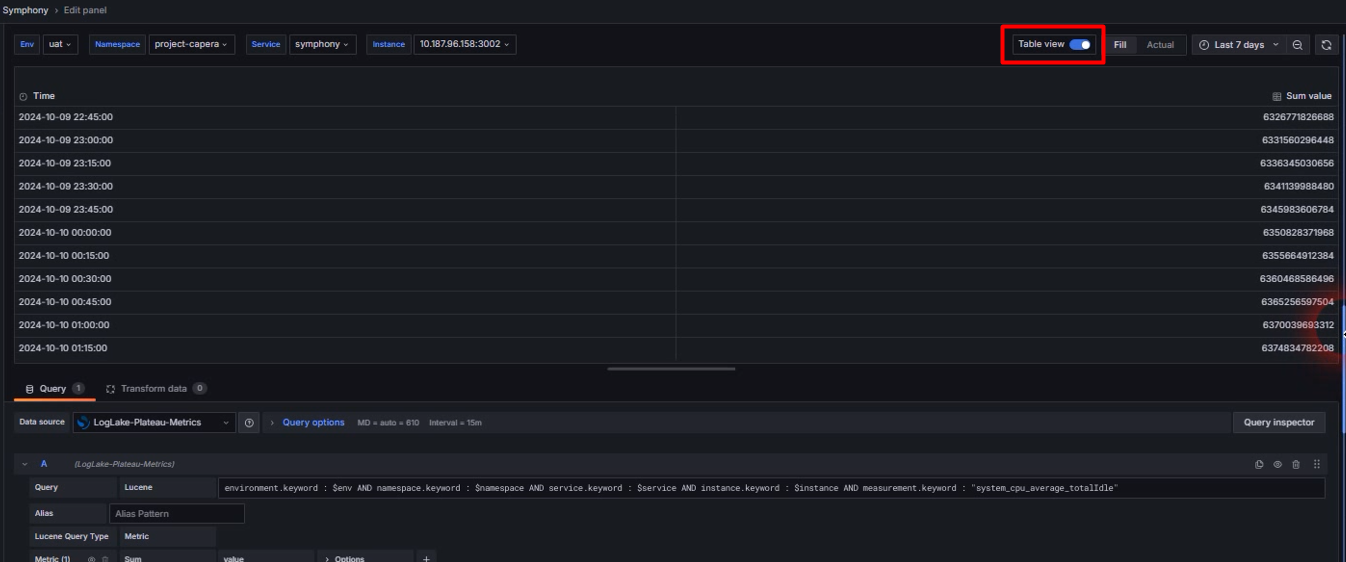
By clicking on Table View within any panel, you can observe how the metrics are displayed as values.
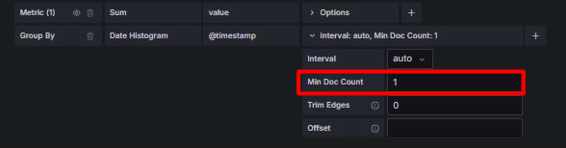
In some cases, it can be observed that the metrics have a value of 0. In such cases, by setting the "Min Doc Count" value under the Group By field in the panel to 1, the values of 0 are disabled. Values of 1 and above are included.
The Gauge panel provides percentages. This panel is commonly used.
Once the meaning of the incoming metrics is understood, it becomes easier to determine which type of panel to use. Then, based on the incoming metric values, it is determined whether it will be average, count, etc.
For example, when examining CPU USAGE, the sample query for this value is as follows.
The part labeled Unit on the right side allows it to be expressed as Percent (0-100).
environment.keyword : $env AND namespace.keyword : $namespace AND service.keyword : $service AND instance.keyword : $instance AND measurement.keyword : "system_cpu_usage"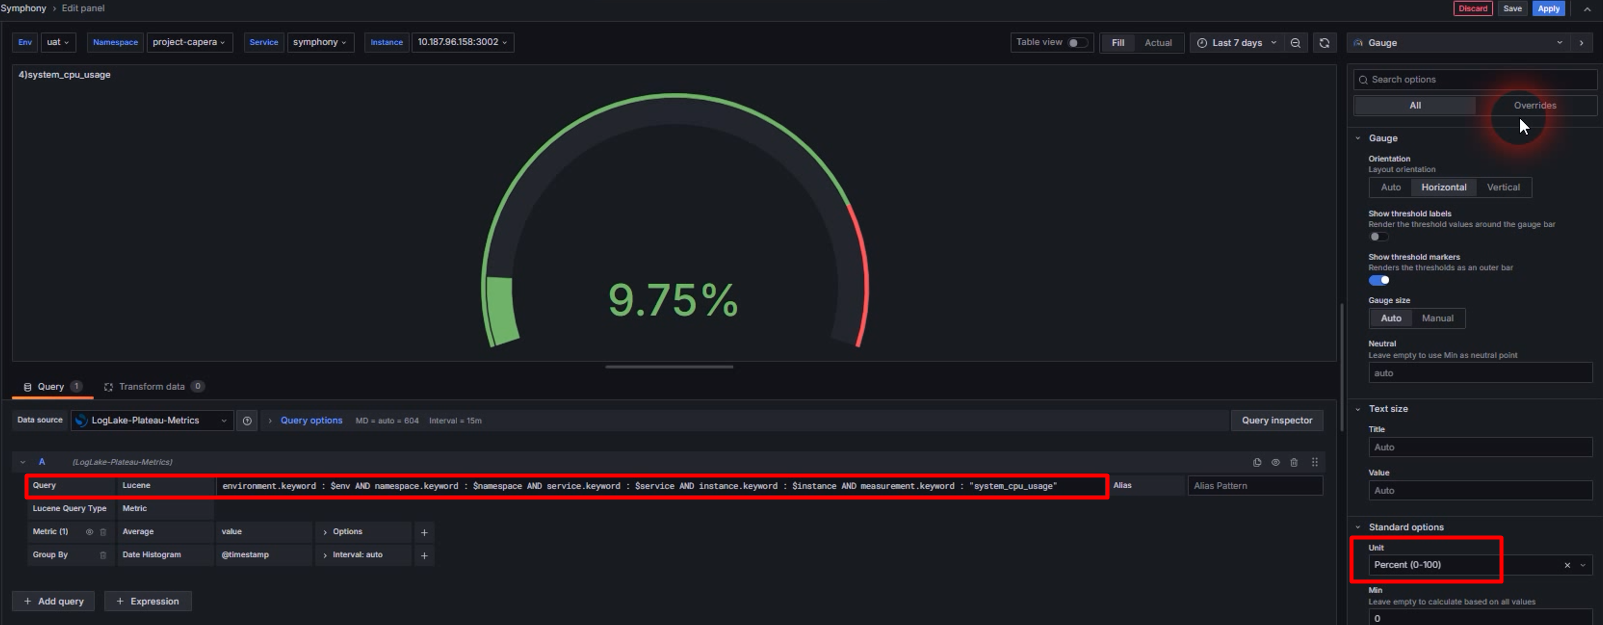
Within the Symphony dashboard, panels have been created using 7 parameters as an example.
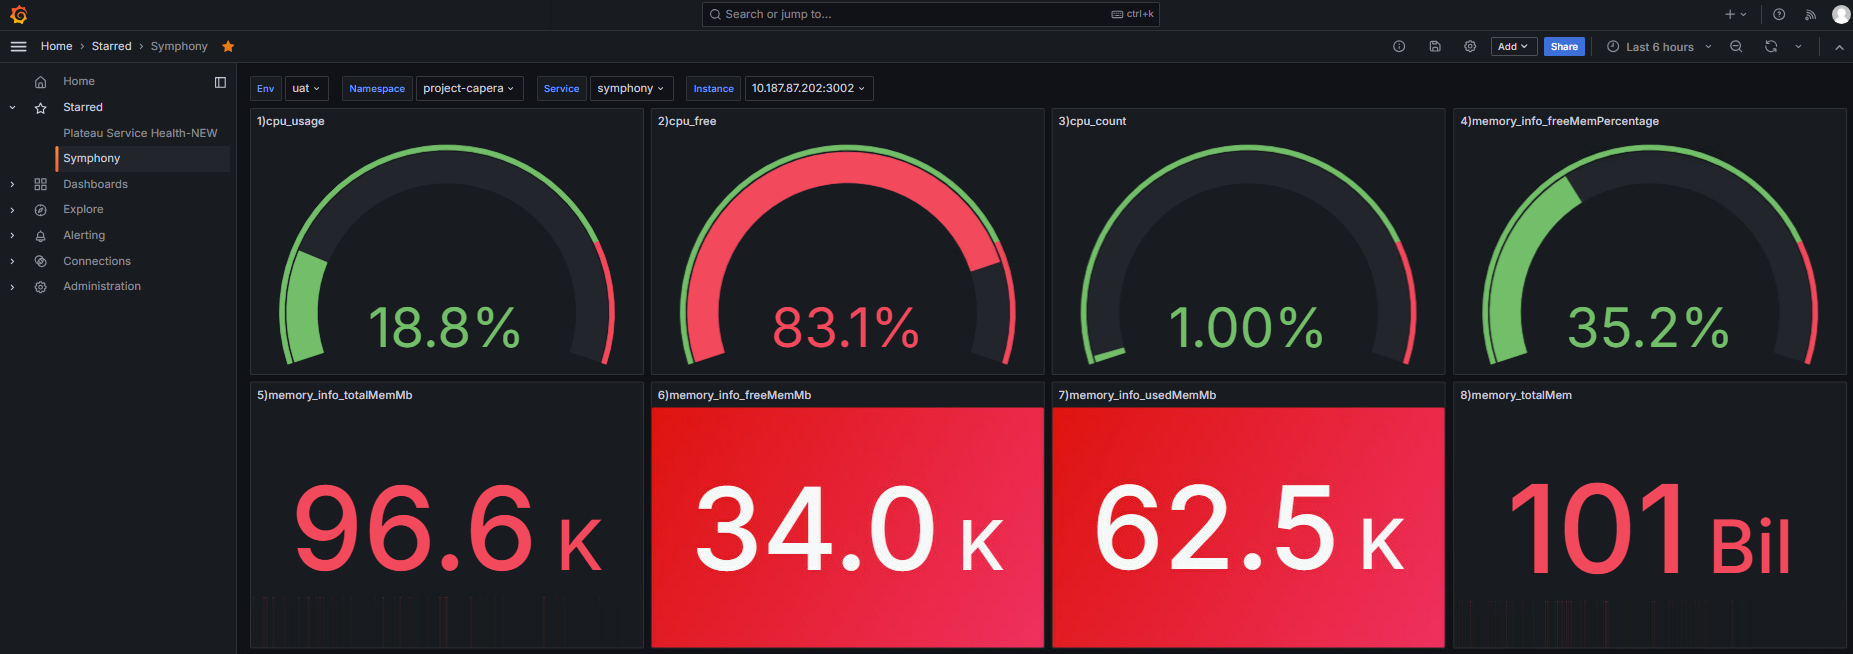
- These parameters are as follows.
- system_cpu_usage=> Returns the CPU usage rate.
- system_cpu_free => Returns the available (idle) CPU resources.
- system_cpu_count=> Gives the number of total CPU cores in the system.
- system_memory_info_freeMemPercentage => Shows the percentage of system memory that is idle.
- system_memory_info_totalMemMb => Indicates the total memory of the system in megabytes (MB).
- system_memory_info_freeMemMb => Indicates the amount of available memory in the system in megabytes (MB).
- system_memory_info_usedMemMb => Indicates the amount of used memory in the system in megabytes (MB).
- These parameters are as follows.