Log
Configure the minimum log levels that determine what is displayed in the console during app execution. Log levels control the granularity of the information captured, helping with debugging and monitoring.
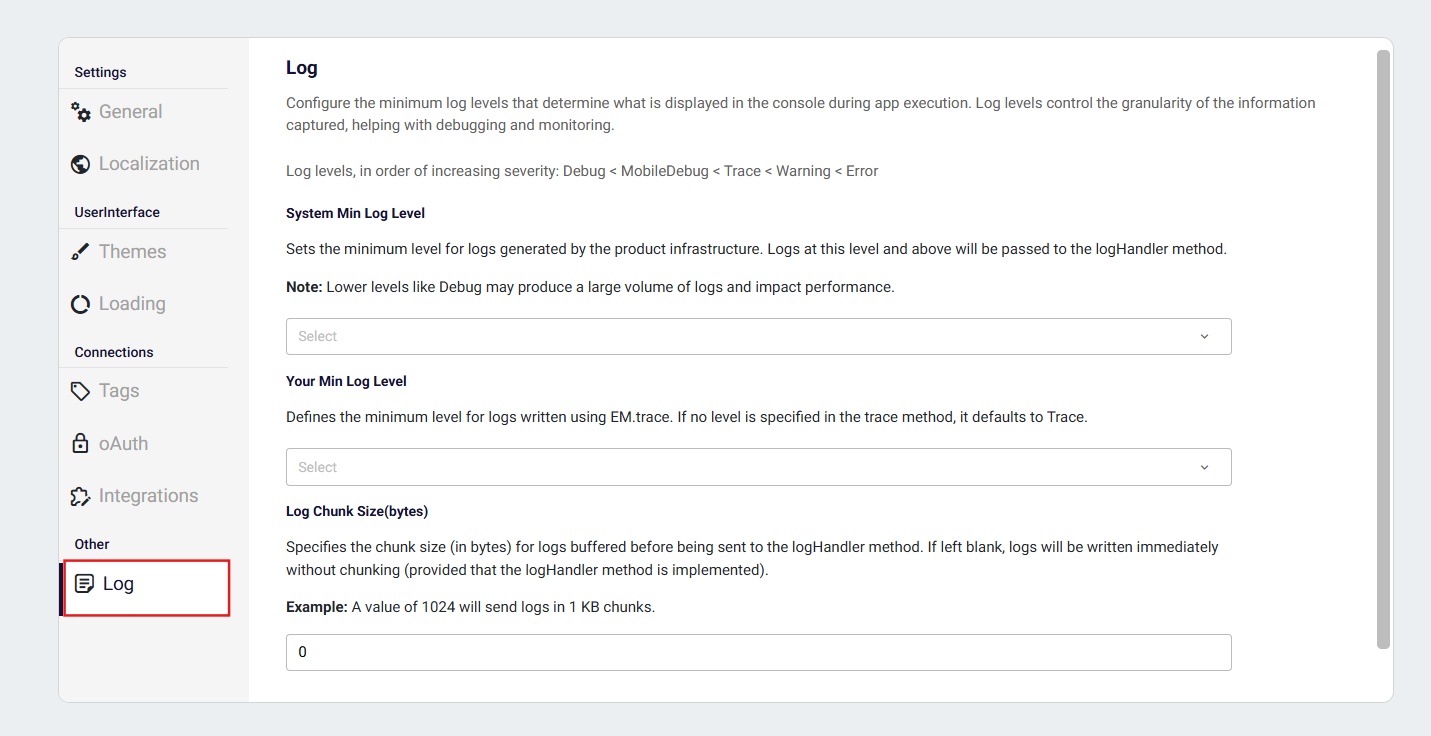
Log levels, in order of increasing severity: Debug < MobileDebug < Trace < Warning < Error
How to Configure Logging
Log behavior and visibility are configured from the Log Settings section in Plateau Studio.
These settings determine which logs are displayed and forwarded to the logHandler.
System Min Log Level
Sets the minimum level for logs generated by the product infrastructure. Logs at this level and above will be passed to the logHandler method. Lower levels like Debug may produce a large volume of logs and impact performance.
Your Min Log Level
Defines the minimum level for logs written using EM.trace. If no level is specified in the trace method, it defaults to Trace.
Log Chunk Size
Specifies the chunk size (in bytes) for logs buffered before being sent to the logHandler method. If left blank, logs will be written immediately without chunking (provided that the logHandler method is implemented).
Example: A value of 1024 will send logs in 1 KB chunks.
How to Implement Trace Logging (EM.trace)
Trace Logging allows you to monitor and record detailed information related to the execution of your applications. It serves as a powerful mechanism for tracking code flow, diagnosing issues, and gaining insights into application behavior during runtime.
When enabled, logs are displayed in the web browser with a green background and white text for clear visibility.
The following lines, when added to the relevant event, enables filtering and printing of logs according to the user's preferences.
quick.EM.trace('Trace Message: Success');

//This line provide users to get Error logs
quick.EM.trace("Log Message", {logType:LogType.Error})

//This line provide users to get Trace logs
quick.EM.trace("Log Message", {logType:LogType.Trace})

//This line provide users to get Warning logs
quick.EM.trace("Log Message", {logType:LogType.Warning})
How to Handle Logs on Client Side
The system described below can be used to process both the logs written on the front end via EM.trace (within the qjson page) and the logs generated by the engine (e.g., service calls, store operations, etc.).
To access and handle these logs, you must define a custom event named logHandler within the PageComponent in the Pipeline Management file. After each log entry is produced, a parameter is passed to this event according to the interface defined below, enabling client-side processing of runtime log output.
interface IMessage {
    message: string // Log message
    type: string // Debug | MobilDebug | Trace | Warning | Error
    time: string // When the browser writes the message
    caller?: string // Caller function of the message
    isClientLog?: boolean // EM.Trace log
}