Line Chart
For all component features for this component, click Line Chart page.
For plugin usage of this component, click Chart Data Labels page.
Props
| Attribute | Description | Type | Default |
|---|---|---|---|
| xType | For Time Cartesian Axis use 'time'i | string | |
| xMin | The minimum item to display. | string | |
| xMax | The maximum item to display. | string | |
| xReverse | Reverse the x scale. | boolean | false |
| yReverse | Reverse the y scale. | boolean | false |
| xTimeDisplayFormatsMillisecond | Sets how different time units are displayed. | string | "h:mm:ss.SSS aaaa" |
| xTimeDisplayFormatsSecond | Sets how different time units are displayed. | string | "h:mm:ss aaaa" |
| xTimeDisplayFormatsMinute | Sets how different time units are displayed. | string | "h:mm aaaa" |
| xTimeDisplayFormatsHour | Sets how different time units are displayed. | string | "ha" |
| xTimeDisplayFormatsDay | Sets how different time units are displayed. | string | "MMM d" |
| xTimeDisplayFormatsWeek | Sets how different time units are displayed. | string | "PP" |
| xTimeDisplayFormatsMonth | Sets how different time units are displayed. | string | "MMM yyyy" |
| xTimeDisplayFormatsQuarter | Sets how different time units are displayed. | string | "qqq - yyyy" |
| xTimeDisplayFormatsYear | Sets how different time units are displayed. | string | "yyyy" |
| xTimeIsoWeekday | If boolean and true and the unit is set to 'week', then the first day of the week will be Monday. Otherwise, it will be Sunday. If number, the index of the first day of the week (0 - Sunday, 6 - Saturday) | boolean or number | |
| xTimeParser | Custom parser for dates | string | |
| xTimeRound | If defined, dates will be rounded to the start of this unit. | string | |
| xTimeTooltipFormat | The format string to use for the tooltip. | string | |
| xTimeUnit | If defined, will force the unit to be a certain type. See Time Units section below for details. | string | . |
| xTimeMinUnit | The minimum display format to be used for a time unit. | string | 'millisecond' |
| xTicksColor | Color of X ticks. | string | |
| xTicksFontFamily | Font Family of X ticks. Default font family for all text. | string | |
| xTicksFontSize | Font Size of X ticks. Default font size (in px) for text. Does not apply to radialLinear scale point labels. | string | 12 |
| xTicksFontStyle | Font Style of X ticks. Default font style. Does not apply to tooltip title or footer. Does not apply to chart title. | string | 'normal' |
| xTicksFontWeight | Font Weight of X ticks. Default font weight (boldness). | string | 'normal' |
| xTicksFontLineHeight | Font Line Height of X ticks. Height of an individual line of text. | string | '1.2' |
| yTicksColor | Color of Y ticks. | string | |
| yTicksFontFamily | Font Family of Y ticks. Default font family for all text. | string | |
| yTicksFontSize | Font Size of Y ticks. Default font size (in px) for text. Does not apply to radialLinear scale point labels. | string | 12 . |
| yTicksFontStyle | Font Style of Y ticks. Default font style. Does not apply to tooltip title or footer. Does not apply to chart title. | string | 'normal' |
| yTicksFontWeight | Font Weight of Y ticks. Default font weight (boldness). | string | 'normal' |
| yTicksFontLineHeight | Font Line Height of Y ticks. Height of an individual line of text. | string | '1.2' |
| ySuggestedMax | Sets the visual maximum value of the Y-axis. | number | |
| xTitleText | Text for the X-axis title. | string | |
| xTitleColor | Color of the X-axis title. | string | |
| xTitleFontSize | Font size for the X-axis title (in px). | string | 12 |
| yTitleText | Text for the Y-axis title. | string | |
| yTitleFontSize | Font size for the Y-axis title (in px). | string | 12 |
| yTitleColor | Color of the Y-axis title. | string | |
| pointRadius | Radius of the point shape | number | 3 |
| pointStyle | Style of the point (e.g., 'circle', 'rect', 'triangle') | string | 'circle' |
| pointRotation | Rotation of the point in degrees | number | |
| pointBackgroundColor | Fill color pf the point | string | |
| pointBorderWidth | Width of the point border | number | |
| pointBorderColor | Color of the point border | string | |
| pointHitRadius | Pixel size to increase the hit area of the point for interaction | number | |
| pointHoverRadius | Radius of the point when hovered | number | |
| pointHoverBorderWidth | Border width of the point when hovered | number | |
| legendFontFamily | Font family used for legend labels (e.g., 'Arial', 'Roboto', 'sans-serif'). Inherits the global font if not specified. | string | |
| legendFontStyle | Font style of the legend text (e.g., 'normal', 'italic', 'oblique'). | string | |
| legendFontWeight | Font weight (boldness) of the legend labels (e.g., 'normal', 'bold', 'lighter', 400, 700). | string | |
| legendFontLineHeight | Line height of legend text. Can be a number (1.2) or a string ('20px', '150%'). | string |
Events
| Attribute | Description | Type |
|---|---|---|
| onClick | A callback that is called when a click event is registered on a label item. Arguments: [event, legendItem, legend]. | function |
| yTicksCallback | Returns the string representation of the Y tick value as it should be displayed on the chart. Arguments: [value, index, ticks]. | function |
| xTicksCallback | Returns the string representation of the X tick value as it should be displayed on the chart. Arguments: [value, index, ticks]. | function |
Samples Component
Line Chart and Data Labels Usage
All of the component features(except options) can be use in this component www.chartjs.org.
All of the Chart Data Labels plugin features can be use in this component.


Time Cartesian Axis
Axes that follow a cartesian grid are known as 'Cartesian Axes'. Cartesian axes are used for line and bar charts. Time cartesian axes are included in Chart.js by default.
The time scale is used to display times and dates. Data are spread according to the amount of time between data points. When building its ticks, it will automatically calculate the most comfortable unit base on the size of the scale.
For More Information:
Time Cartesian AxisTime Display Formats

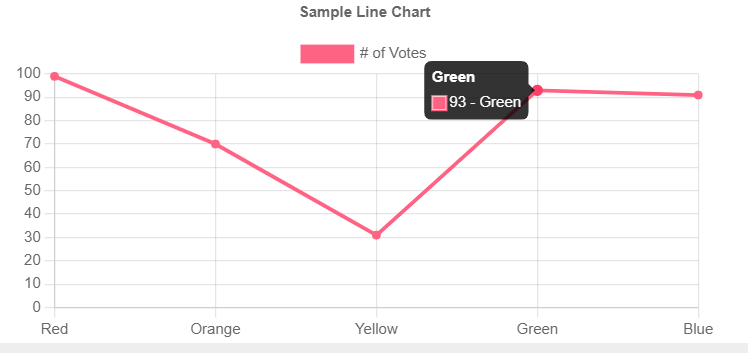
Tooltip Label
tooltipLabel(context) event added to Charts component. Returns text to render for an individual item in the tooltip. The label can change the text that displays for a given data point.
For more detail Charts tooltip-callbacks
quick.return(context.formattedValue + " - " + context.label);
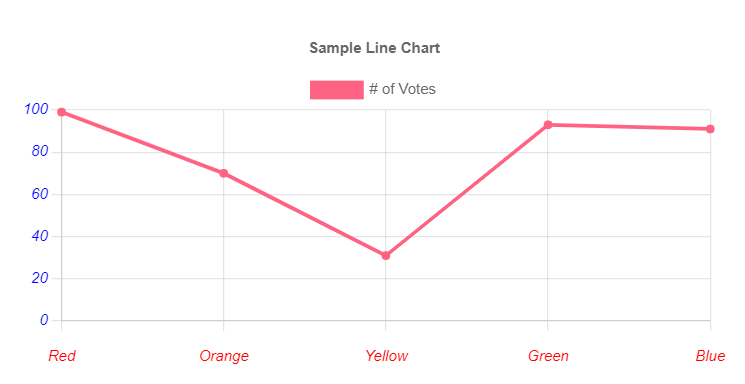
Ticks Font
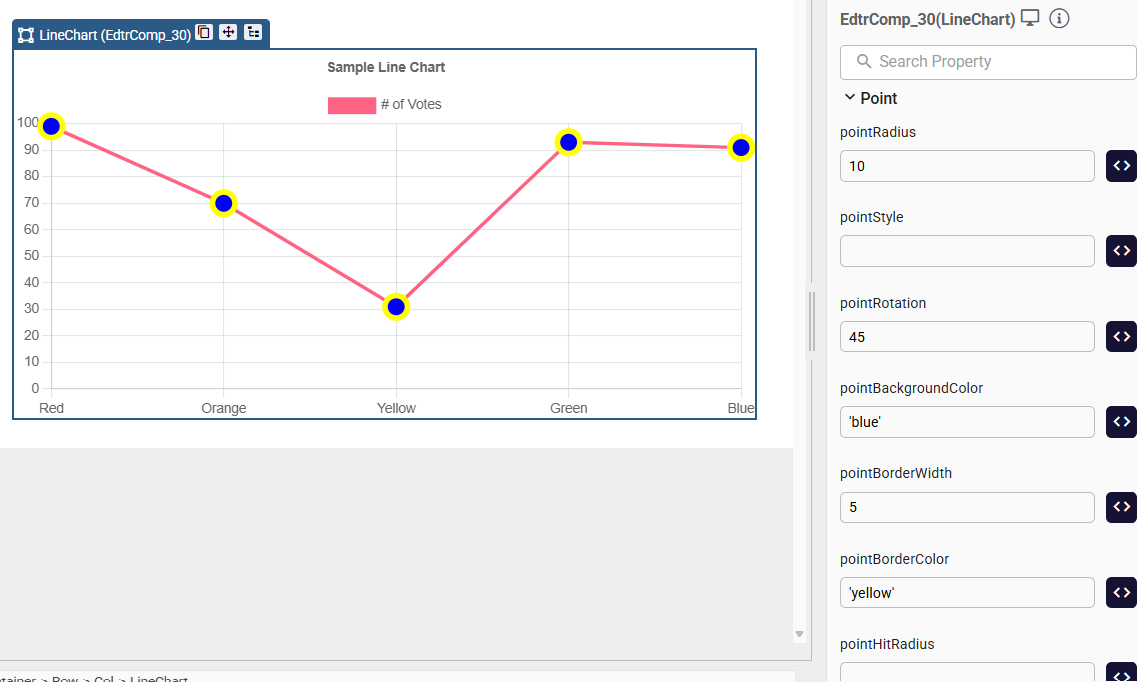
Point Styling and Interaction Options
These properties allow customization of data point appearance and interaction behavior on the line chart. You can adjust the shape, size, color, border, and hover effects of the points rendered on the chart.
LineChart.qjson
Samples Qjson
LineChart.qjsonLineChartEvents.qjson
LineChart_Type_Time_Sample.qjson
Charts_Custom_Legend_Sample.qjson
Charts_tooltipLabel_sample.qjson
LineChart_TicksCallback.qjson